date: “2019-11-30” title: “Service Mesh Brain Dump (ALWAYS WIP)” author : “Nanik Tolaram (nanikjava@gmail.com)”
Service Mesh
- Resources
- Consul whitepaper that explains about service mesh.
- Consul whitepaper that explains about service mesh.
- A service mesh is a software-driven approach to routing and segmentation. The goal is to solve the networking and security challenges of operating microservices and cloud infrastructure. Service mesh solutions bring additional benefits such as failure handling, retries, and network observability. A service mesh is an abstract concept that solves multiple service networking challenges in an integrated way.
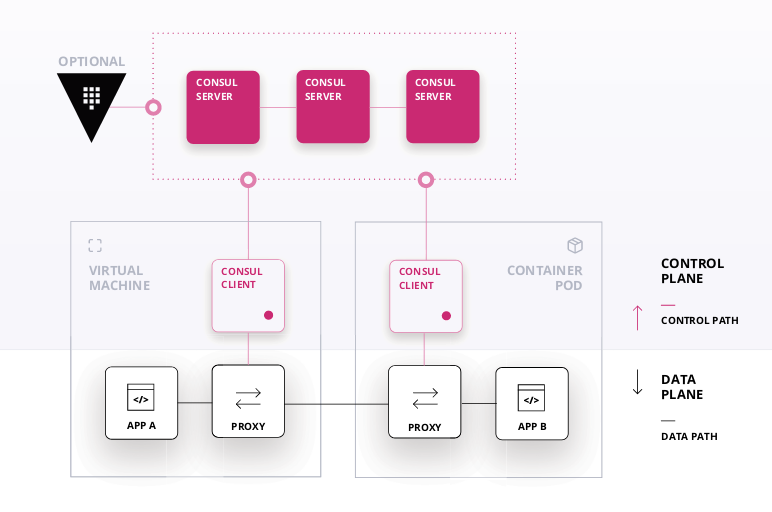
- Following diagrams show the simplest diagram of what service mesh is all about
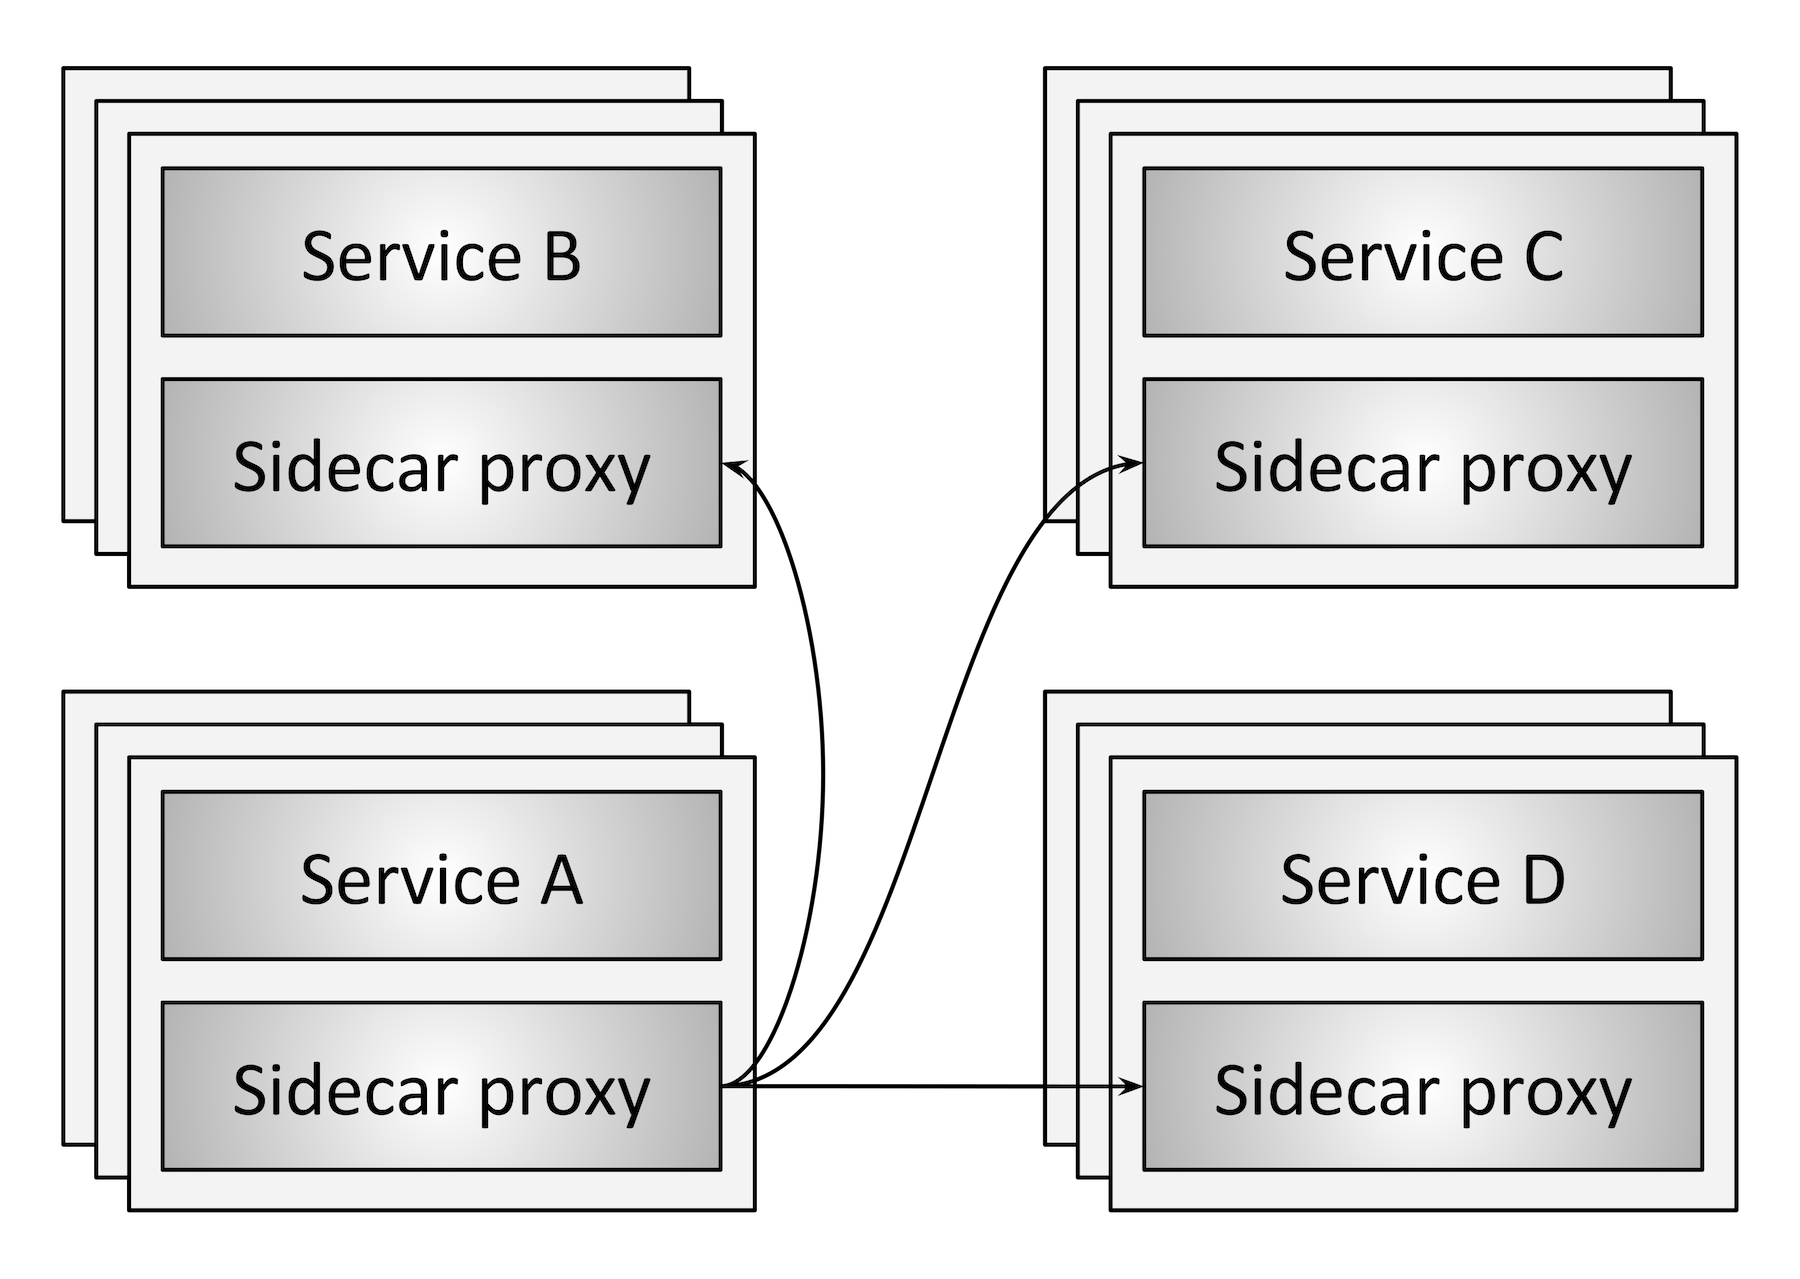
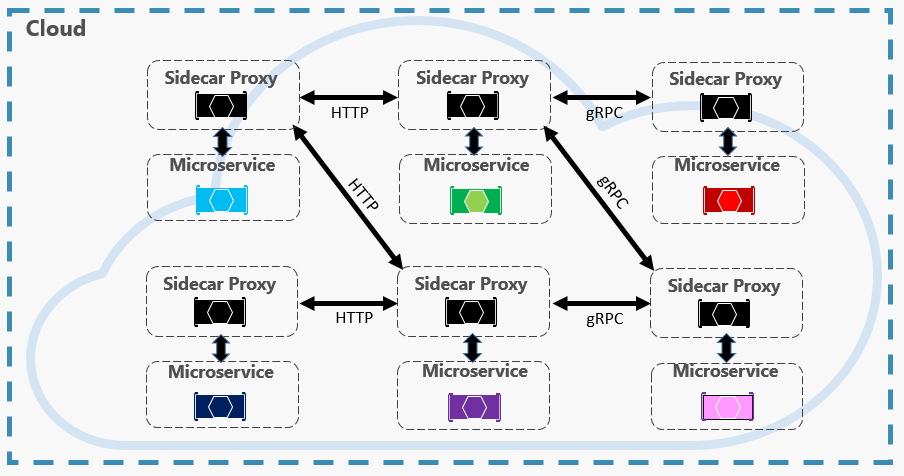
- A service mesh has two key components
- Control Plane – The control plane holds the state of the system and plays a coordination role. It provides a centralized registry of where services are running, and the policies that restrict traffic. It must scale to handle tens of thousands of service instances, and efficiently update the data plane in real time.
- Data Plane – The data plane is distributed and responsible for transmission of data between different services. It must be high-performance and integrate with the control plane.
- Following are some of the projects that perform the above 2 different planes
- Data planes – Linkerd, NGINX, HAProxy, Envoy, Traefik
- Control planes – Istio, Nelson, SmartStack
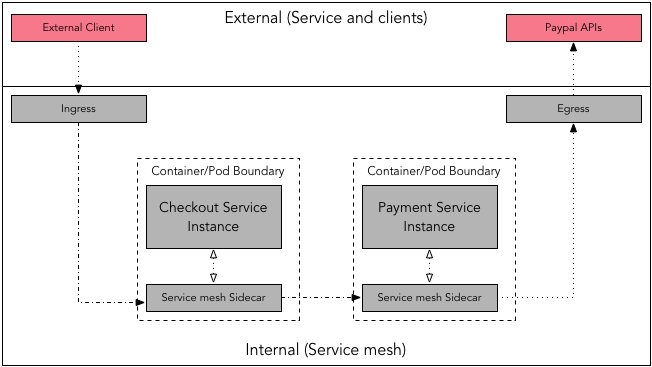
- Ingress – term used for incoming request
- Egress – term used for outgoing request
By default, proxies handle only intra-service mesh cluster traffic - between the source (upstream) and the destination (downstream) services. To expose a service which is part of service mesh to outside word, you have to enable ingress traffic. Similarly, if a service depends on an external service you may require enabling the egress traffic.
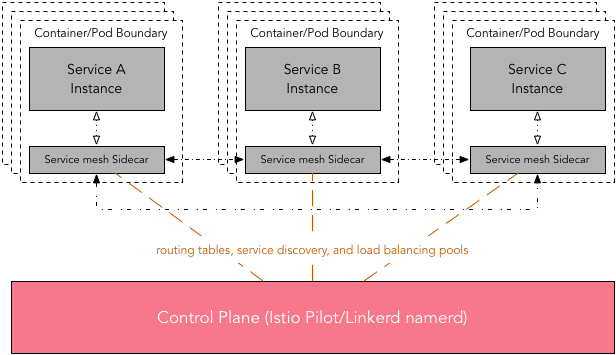
Due to distributed nature of service mesh, a control plane or a similar centralized management utility is desirable. This elps in the management of routing tables, service discovery, and load balancing pools.
API Gateway vs Service Mesh
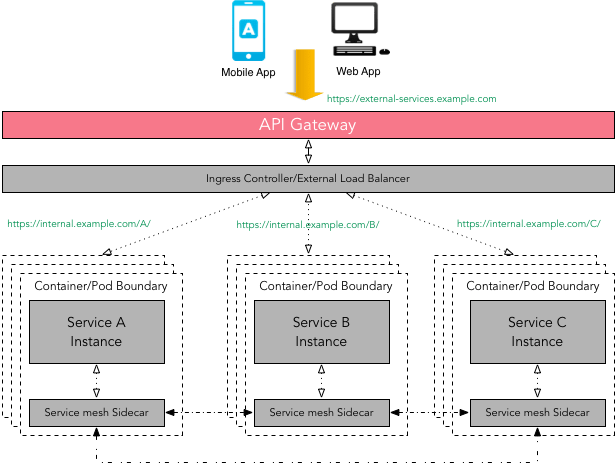
- There is some overlap between API Gateway and Service mesh patterns i.e. request routing, composition, authentication, rate limiting, error handling, monitoring, etc. The primary focus of a service mesh is service-to-service communication (internal traffic), whereas an API Gateway offers a single entry point for external clients such as a mobile app or a web app used by end-user to access services (external traffic).
- Technically one can use API Gateway to facilitate internal service-to-service communication but not without introducing the latency and performance issues. As the composition of services can change over time and should be hidden from external clients - API Gateway makes sure that this complexity is hidden from the external client.
- It is important to note that a service mesh can use a diverse set of protocols (RPC/gRPC/REST), some of which might not be friendly to external clients.
API Gateway can handle multiple types of protocols and if can support protocol translation if required. There is no reason why one can not use API Gateway in front of a service mesh.
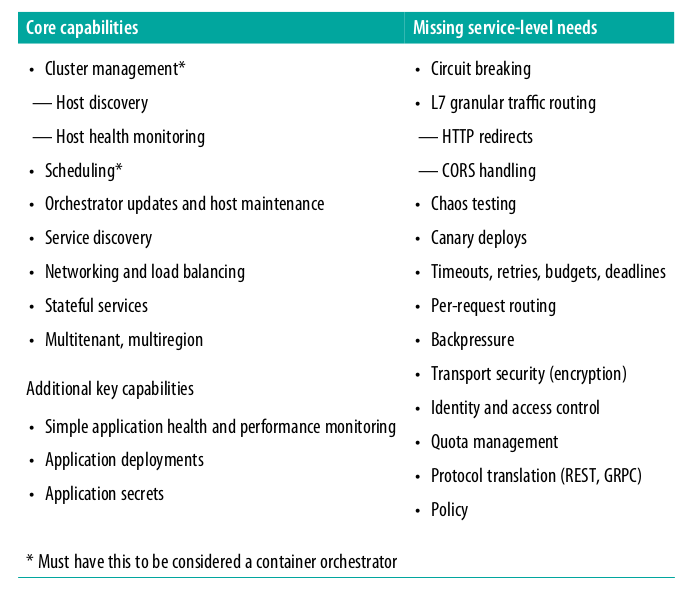
Remember that even thought we are using container orchestration this will not take care of what microservices will need. Container orchestration does not provide what microservice application need that are specificly relevant for the application such as - finding other microservice application, app-to-app communication (gRPC), app-to-app security (session, token, etc). Following table outlined the difference
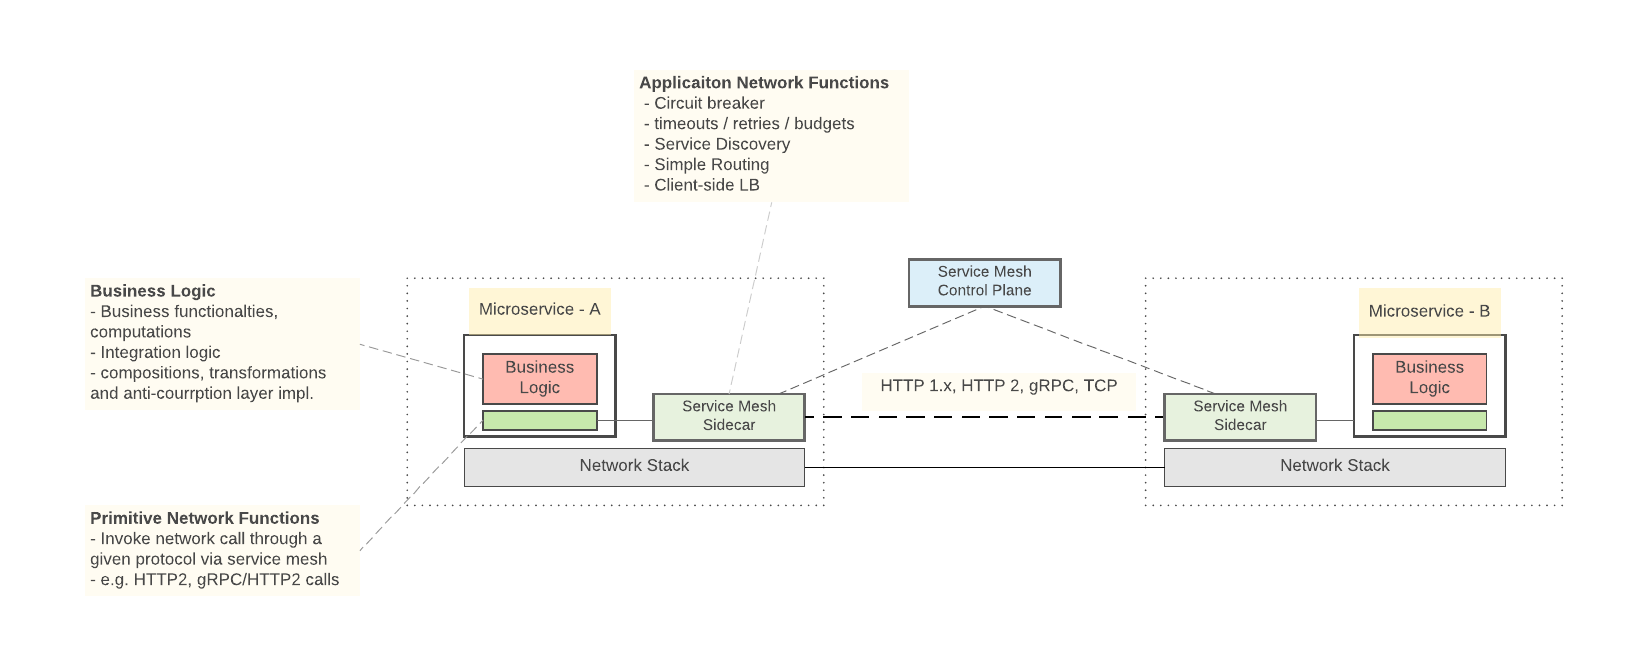
- In service mesh architecture we need resiliency features such as circuit breaking, timeouts, deadlines, etc.
- Don’t think service mesh as a technology, think of it as an abstract concept that bring services together and mesh them together as a single entity.
Consul
- Following is a high level diagram showing how consul works as a control plane capacity
Istio
- Resources
- The explanation in this article is extracted from here
- Indepth article about the traffic flow using envoy as sidecar
- An indepth article on creating your own sidecar proxy for app running in Kubernetes.
- Cloud patterns
- Using kiali.io with Istio presentation
- Istio provides automatic injection of sidecar proxy in Kubernetes
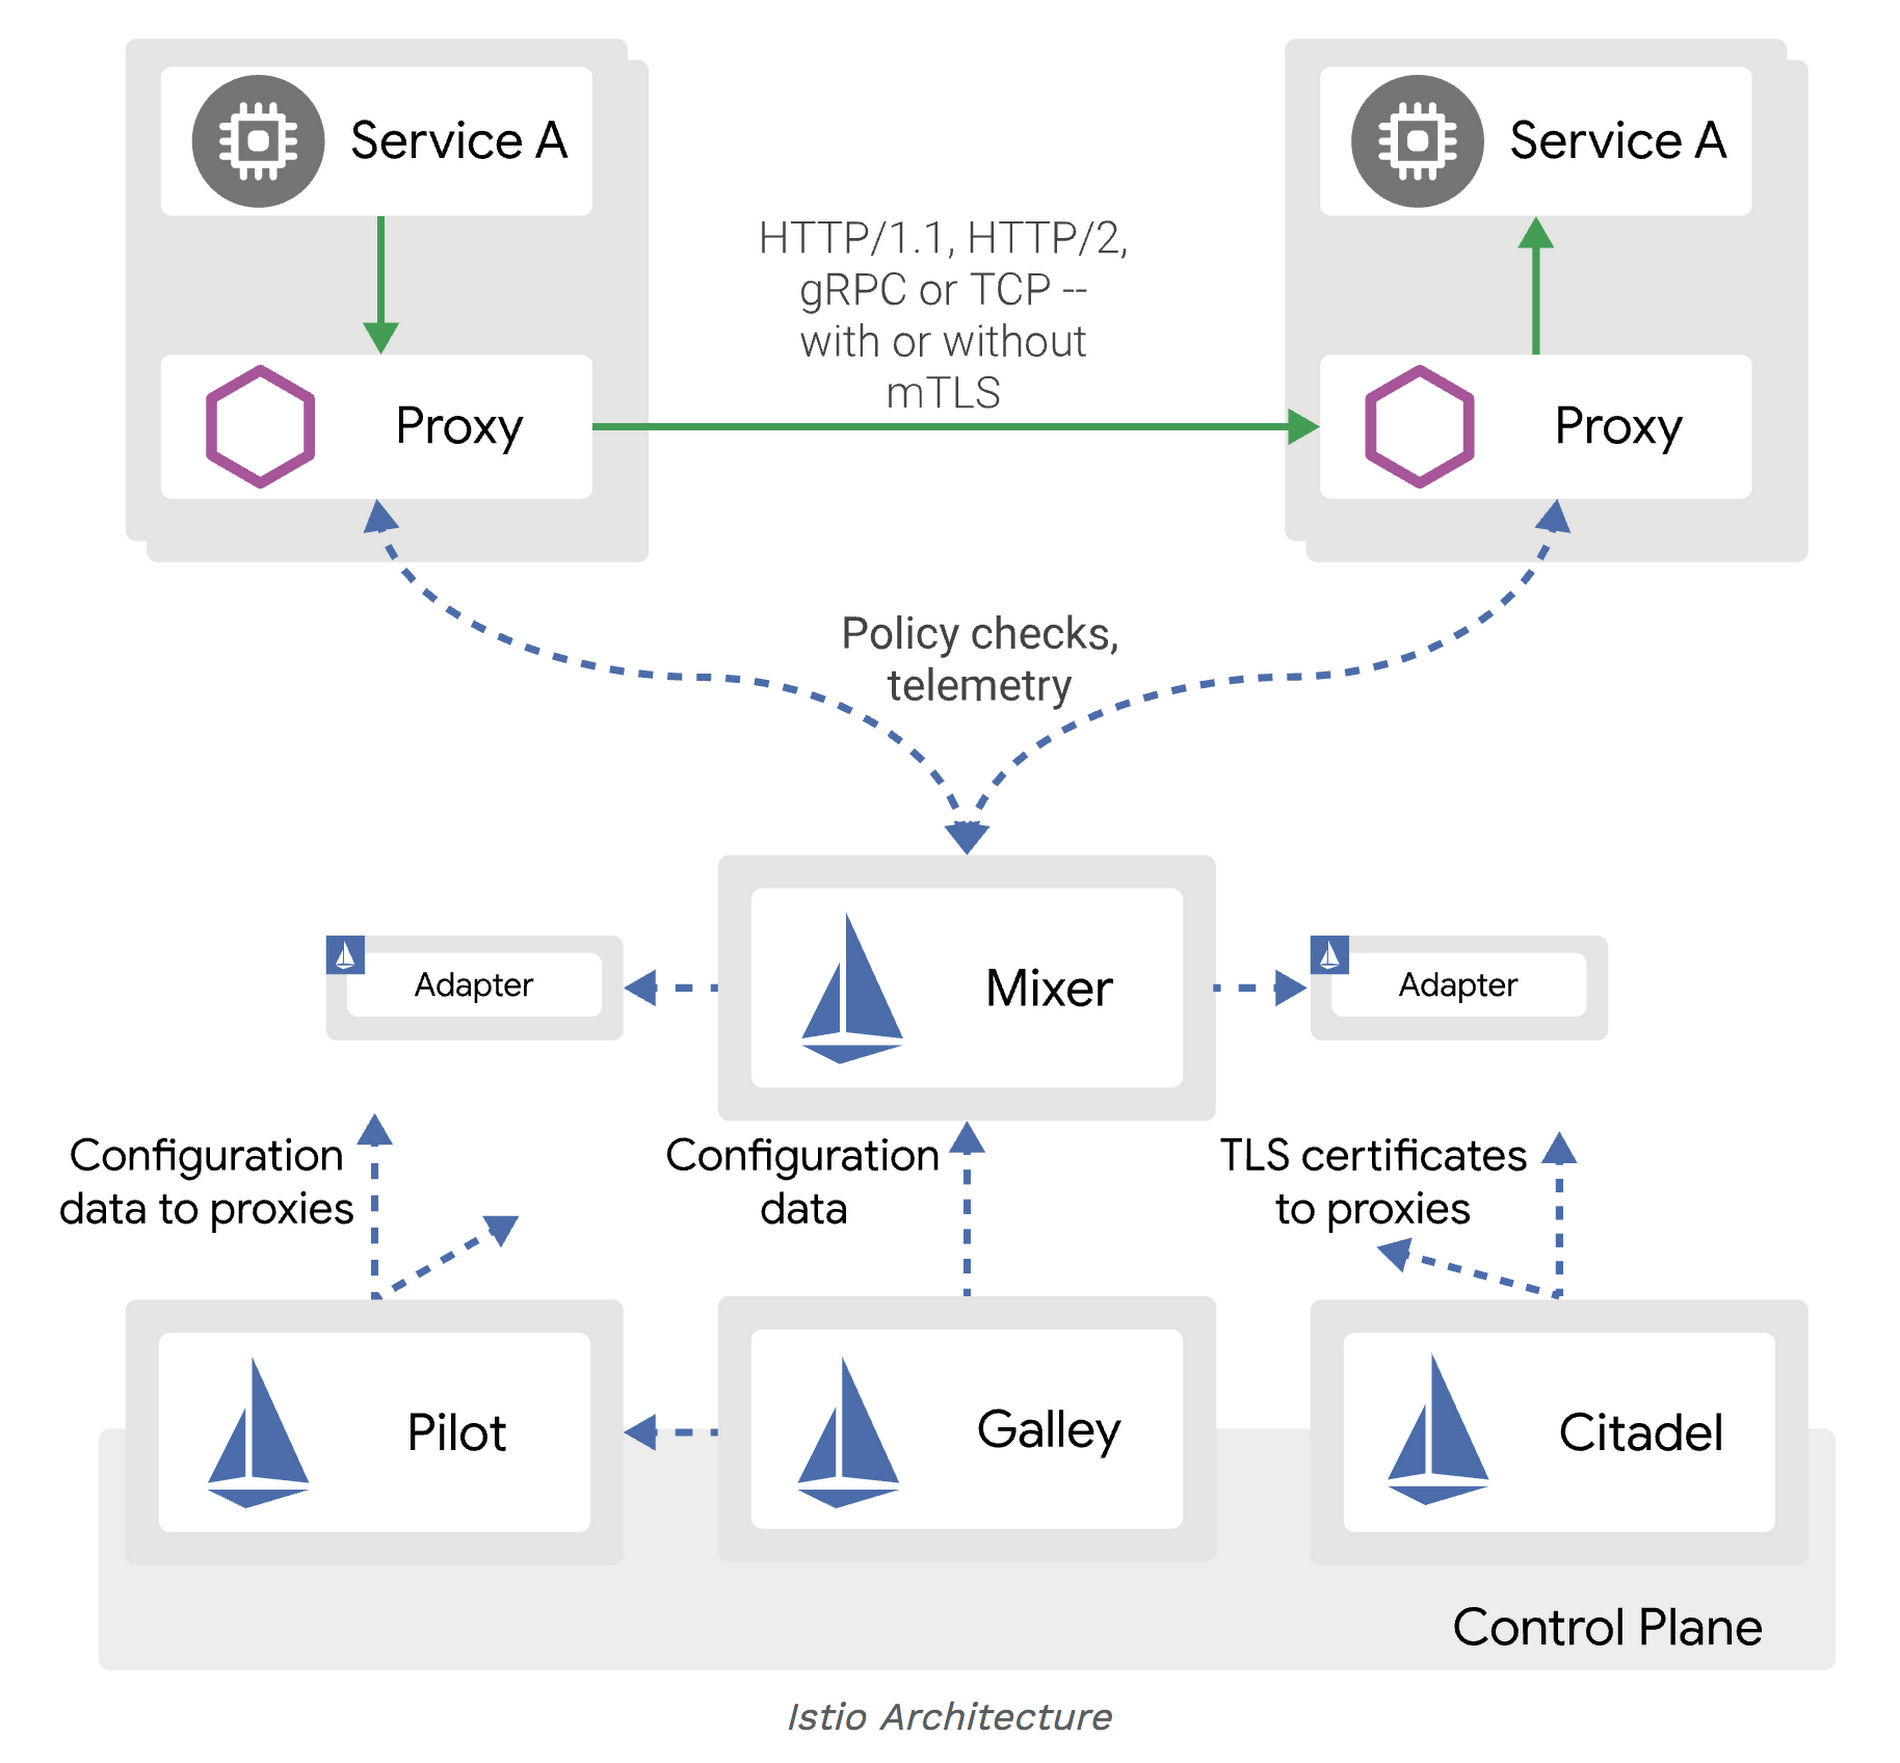
- Istio control plane consist of - Mixer, Pilot and Citadel.
In simple terms, sidecar injection is adding the configuration of additional containers to the pod template. The added containers needed for the Istio service mesh are:
- istio-init This init container is used to setup the iptables rules so that inbound/outbound traffic will go through the sidecar proxy. An init container is different than an app container in following ways:
- It runs before an app container is started and it always runs to completion.
- If there are many init containers, each should complete with success before the next container is started.
- istio-init This init container is used to setup the iptables rules so that inbound/outbound traffic will go through the sidecar proxy. An init container is different than an app container in following ways:
So, you can see how this type of container is perfect for a set-up or initialization job which does not need to be a part of the actual application container. In this case, istio-init does just that and sets up the iptables rules. istio-proxy This is the actual sidecar proxy (based on Envoy). * This is done by labelling the namespace where you are deploying the app with istio-injection=enabled
kubectl get namespaces --show-labelsNAME STATUS AGE LABELS
default Active 40d <none>
istio-dev Active 19d istio-injection=enabled
istio-system Active 24d <none>
kube-public Active 40d <none>
kube-system Active 40d <none>For automatic sidecar injection, Istio relies on Mutating Admission Webhook. Following is the instruction used to get the webhook info
kubectl get mutatingwebhookconfiguration istio-sidecar-injector -o yamlapiVersion: admissionregistration.k8s.io/v1beta1 kind: MutatingWebhookConfiguration metadata: annotations: kubectl.kubernetes.io/last-applied-configuration: | {"apiVersion":"admissionregistration.k8s.io/v1beta1","kind":"MutatingWebhookConfiguration","metadata":{"annotations":{},"labels":{"app":"istio-sidecar-injector","chart":"sidecarInjectorWebhook-1.0.1","heritage":"Tiller","release":"istio-remote"},"name":"istio-sidecar-injector","namespace":""},"webhooks":[{"clientConfig":{"caBundle":"","service":{"name":"istio-sidecar-injector","namespace":"istio-system","path":"/inject"}},"failurePolicy":"Fail","name":"sidecar-injector.istio.io","namespaceSelector":{"matchLabels":{"istio-injection":"enabled"}},"rules":[{"apiGroups":[""],"apiVersions":["v1"],"operations":["CREATE"],"resources":["pods"]}]}]} creationTimestamp: 2018-12-10T08:40:15Z generation: 2 labels: app: istio-sidecar-injector chart: sidecarInjectorWebhook-1.0.1 heritage: Tiller release: istio-remote name: istio-sidecar-injector ..... webhooks: - clientConfig: service: name: istio-sidecar-injector namespace: istio-system path: /inject name: sidecar-injector.istio.io namespaceSelector: matchLabels: istio-injection: enabled rules: - apiGroups: - "" apiVersions: - v1 operations: - CREATE resources: - podsCan see the webhook namespaceSelector label that is matched for sidecar injection with the label istio-injection: enabled.
The ‘app’ that is intercepting this request is as follows
kubectl get svc --namespace=istio-system | grep sidecar-injectoristio-sidecar-injector ClusterIP 10.102.70.184 <none> 443/TCP 24dNow that we are clear about how a sidecar container and an init container are injected into an application manifest, how does the sidecar proxy grab the inbound and outbound traffic to and from the container? We did briefly mention that it is done by setting up the iptable rules within the pod namespace, which in turn is done by the istio-init container. Now, it is time to verify what actually gets updated within the namespace.
Let’s get into the application pod namespace we deployed in the previous section and looked at the configured iptables. I am going to show an example using nsenter. Alternatively, you can enter the container in a privileged mode to see the same information. For folks without access to the nodes, using exec to get into the sidecar and running iptables is more practical.
Get the pid of the container that has the sidecar proxy running (normally this is our app container)
docker inspect b8de099d3510 --format '{{ .State.Pid }}'enter into the container and execute the command
nsenter -t 4215 -n iptables -t nat -SThe output will be as follows
-P PREROUTING ACCEPT
-P INPUT ACCEPT
-P OUTPUT ACCEPT
-P POSTROUTING ACCEPT
-N ISTIO_INBOUND
-N ISTIO_IN_REDIRECT
-N ISTIO_OUTPUT
-N ISTIO_REDIRECT
-A PREROUTING -p tcp -j ISTIO_INBOUND
-A OUTPUT -p tcp -j ISTIO_OUTPUT
-A ISTIO_INBOUND -p tcp -m tcp --dport 80 -j ISTIO_IN_REDIRECT
-A ISTIO_IN_REDIRECT -p tcp -j REDIRECT --to-ports 15001
-A ISTIO_OUTPUT ! -d 127.0.0.1/32 -o lo -j ISTIO_REDIRECT
-A ISTIO_OUTPUT -m owner --uid-owner 1337 -j RETURN
-A ISTIO_OUTPUT -m owner --gid-owner 1337 -j RETURN
-A ISTIO_OUTPUT -d 127.0.0.1/32 -j RETURN
-A ISTIO_OUTPUT -j ISTIO_REDIRECT
-A ISTIO_REDIRECT -p tcp -j REDIRECT --to-ports 15001- Internal diagrams
- Following are resources that gives detail explanation on working with Istio
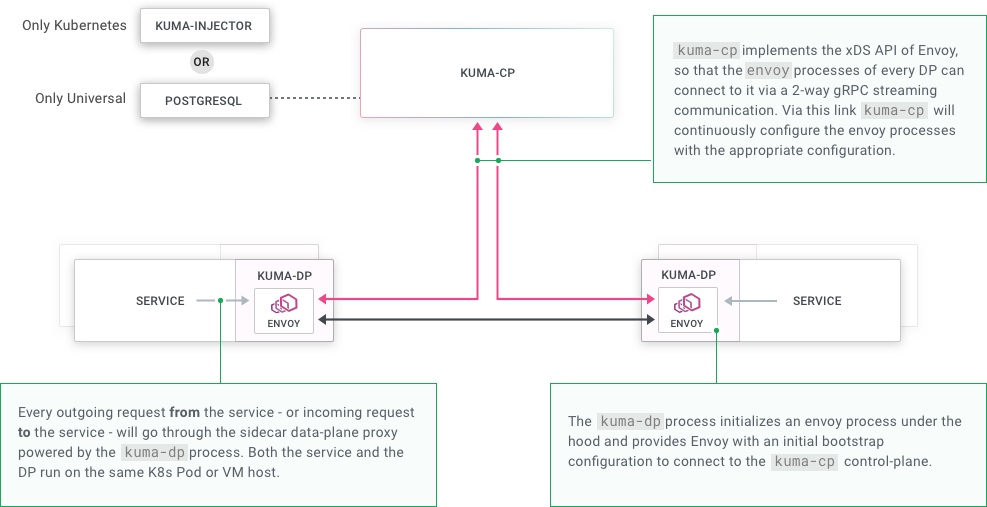
Kuma
Kuma is an open source service mesh project that provides both control and data plane functionality. The interesting part about this project is the ability to use it for both Kubernetes and non-Kubernetes environment (bare metal and VM).
Following are the steps to run the sample app in kuma:
Run kuma-echo sample app
Run the kuma-cp run
Generate Dataplane data
echo "type: Dataplane
mesh: default
name: dp-echo-1
networking:
  inbound:
  - interface: 127.0.0.1:10000:9000
    tags:
      service: echo" | ./kumactl apply -f -
Generate the data token using the following
./kumactl generate dataplane-token --dataplane=dp-echo-1 > /tmp/kuma-dp-echo-1Run kuma-dp using the generated token as follows
./kuma-dp run --name=dp-echo-1 --mesh=default --cp-address=http://127.0.0.1:5681 --dataplane-token-file=/tmp/kuma-dp-echo-1Debugging through kuma-dp following is the generated configuration used for envoy
and following is the configuration used to run envoydynamicResources: adsConfig: apiType: GRPC grpcServices: - envoyGrpc: clusterName: ads_cluster cdsConfig: ads: {} ldsConfig: ads: {} node: cluster: echo id: default.dp-echo-1 metadata: dataplaneTokenPath: /tmp/kuma-dp-echo-1 staticResources: clusters: - connectTimeout: 1s http2ProtocolOptions: {} loadAssignment: clusterName: ads_cluster endpoints: - lbEndpoints: - endpoint: address: socketAddress: address: localhost portValue: 5678 name: ads_cluster type: STRICT_DNS upstreamConnectionOptions: tcpKeepalive: {} - connectTimeout: 1s http2ProtocolOptions: {} loadAssignment: clusterName: access_log_sink endpoints: - lbEndpoints: - endpoint: address: pipe: path: /tmp/kuma-access-logs-dp-echo-1-default.sock name: access_log_sink type: STATIC upstreamConnectionOptions: tcpKeepalive: {}0 = {string} "-c" 1 = {string} "/tmp/kuma-dp-443537827/bootstrap.yaml" 2 = {string} "--drain-time-s" 3 = {string} "30" 4 = {string} "--disable-hot-restart"